StageSense is currently in development and not yet available.
Overview & SitesPowerLighting & MAConsole DiagnosticsNetworkAlerts & NotificationsBlackbox & ReportsWeb App & PhoneServer, Client & Bridge

Features

Overview & Sites

Overall page, one page per site, details for every figure, matrix, weak spots, hall plan and big screen.

Screenshots show the app in German with demo data; English screenshots follow with version 1.4.

Overall page

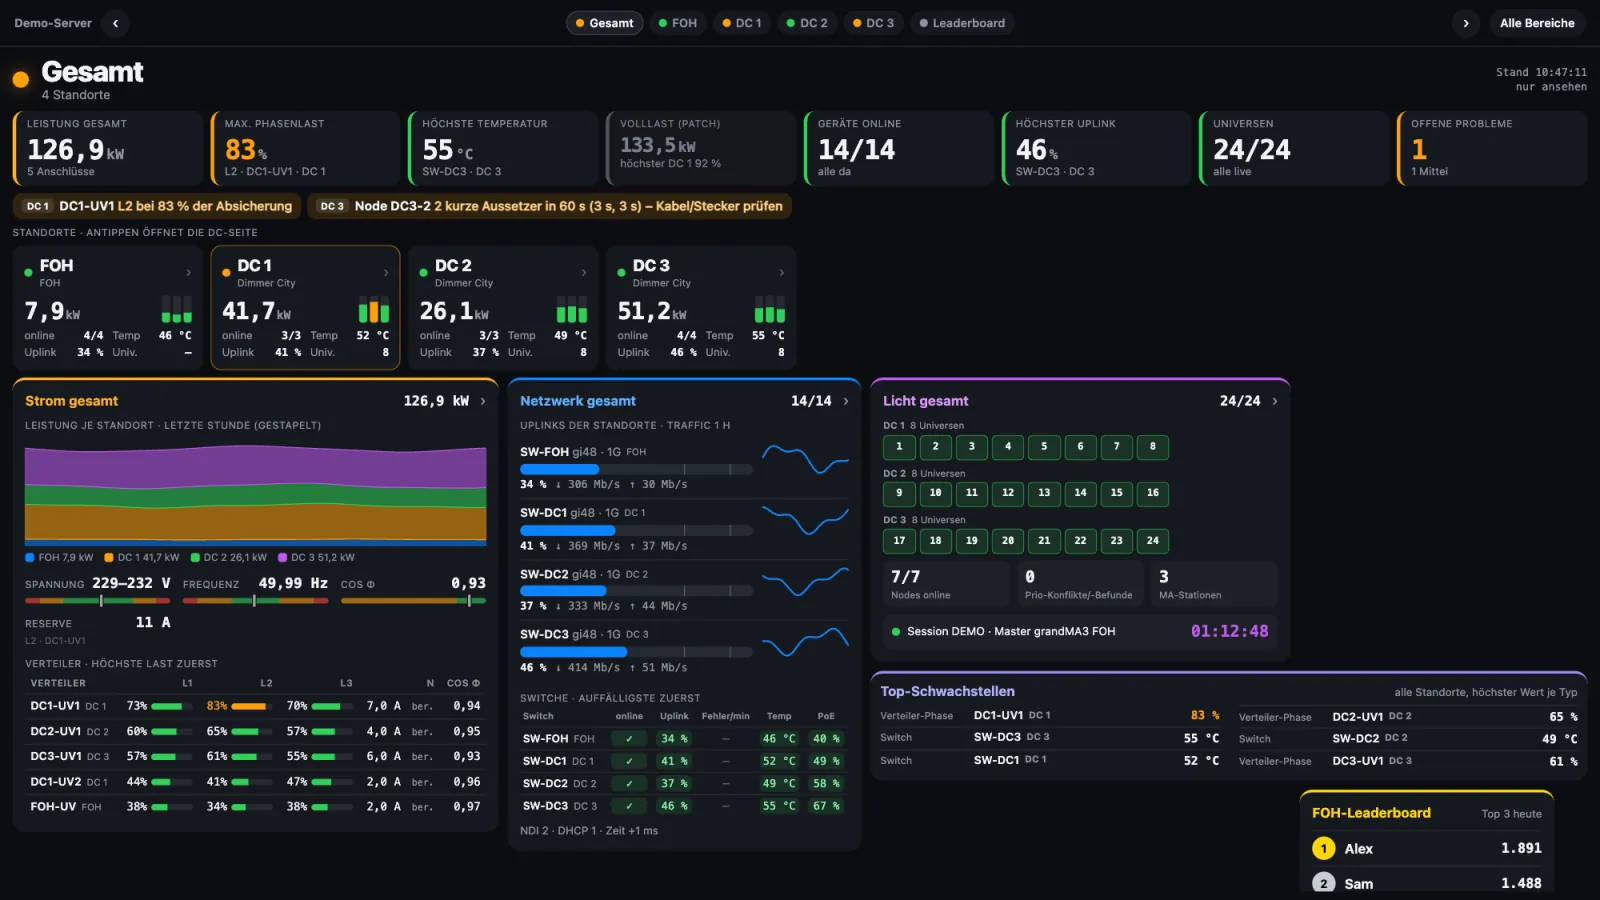
The overall page shows the whole production at a glance. At the top a band of large key figures, each with its location: total power with the smallest headroom to the breaker, the highest phase load, the highest temperature, devices online, the busiest uplink, the universes and the open problems.

Below that the problems of all sites as chips with a site badge, the site cards with status light, power and phase bars, and power, network and lighting overall – power as a stacked area per site, network with all uplinks, lighting with all universes by site. Anything unusual moves to the top.
Overall page in the manual (German)

Overall page: key figure band, two open problems, cards for FOH and DC 1 to DC 3, below power, network and lighting overall
Overall page in the web app · demo data

One page per site

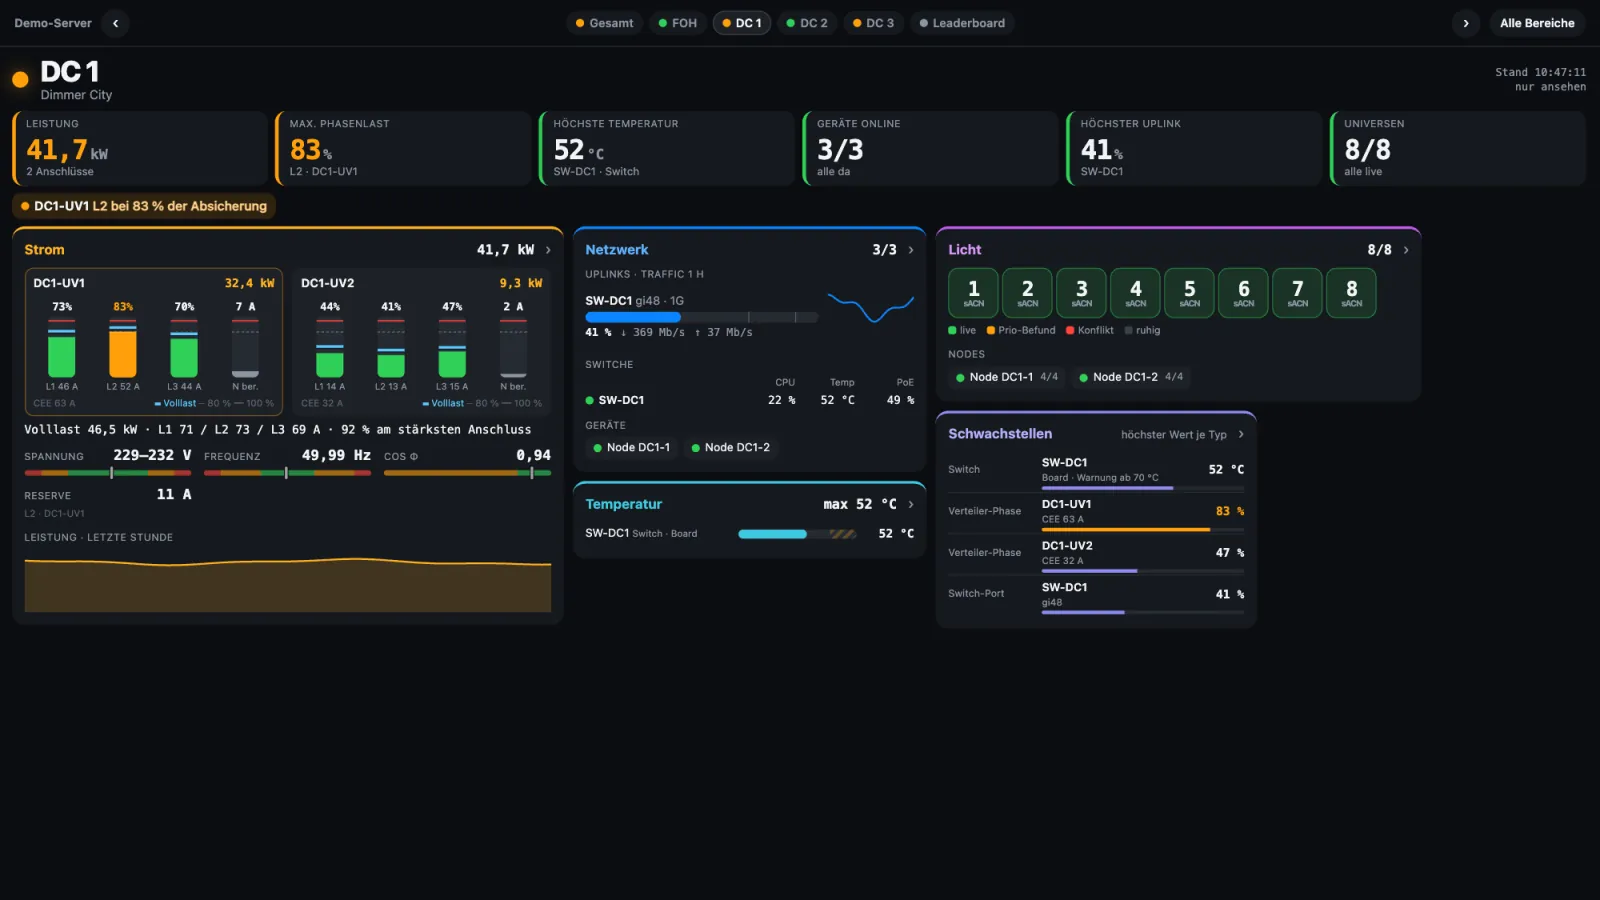
Every site – FOH, DC 1, DC 2, the stage or a rack – gets the same page: key figures and problems at the top, below power with phase bars against the breaker, network with uplink and switches, lighting with universes and nodes, temperatures and weak spots. At FOH the consoles with session and timecode come first.

Each page fits on one screen without scrolling – 1080p, iPad landscape or phone landscape. Swipe, use the arrow keys or the dots at the top to move to the next site.

DC page in the manual (German)

DC page DC 1: key figures, a warning at 83 percent on L2, power of two distros, network, lighting with eight universes, weak spots and temperature
DC page DC 1 · demo data

Details for every figure New in 1.3.5

Tap a figure or tile to see everything on that topic for this site: temperature, consoles, problems, power, UPS, network, lighting or weak spots. On a monitor or a tablet in landscape the detail opens as a sidebar on the right while the page keeps running; on a phone it opens full screen.

Tables sort by column header, chips filter, a row with a device opens the device page. Every detail has its own link, e.g. /dc/FOH/pulte – handy as a fixed screen at FOH.

Details in the manual (German)

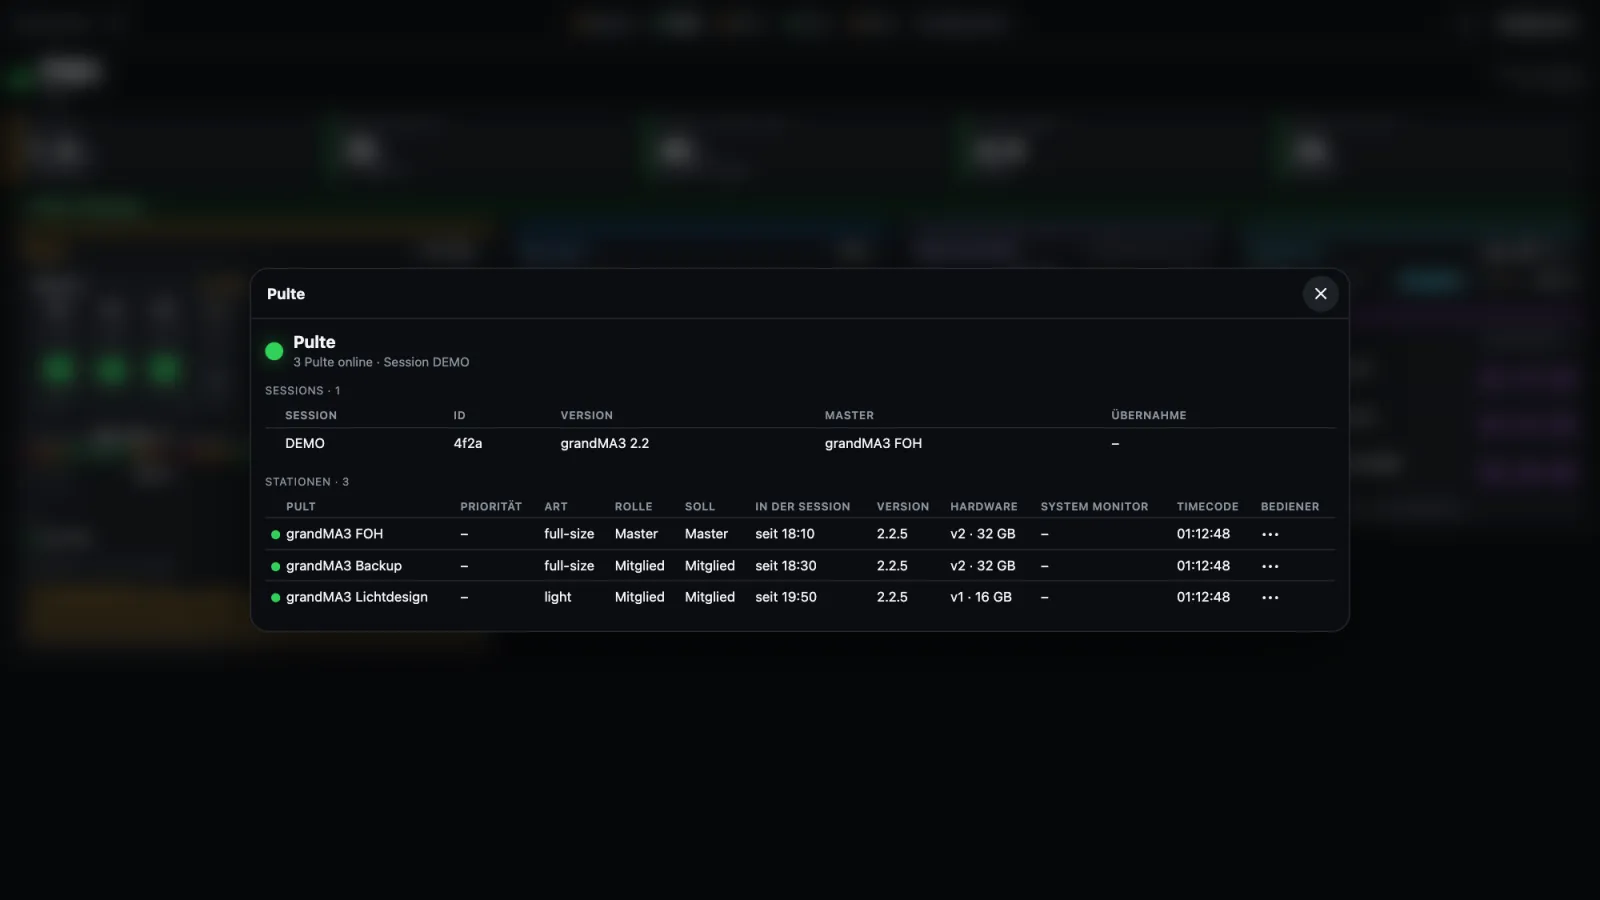
FOH page with the consoles detail open on the right: session DEMO with master and three stations with type, role, version, hardware and timecode
Consoles detail at FOH · demo data

Details on the Mac, too

In the Mac app the same detail opens as a pop-up over the page – with the same numbers, because Mac and web app share one calculation. The pop-up never shortens a cell, wide tables scroll sideways; tapping a device in it opens its device page in the same pop-up. “Copy link” fetches the address for the web app.

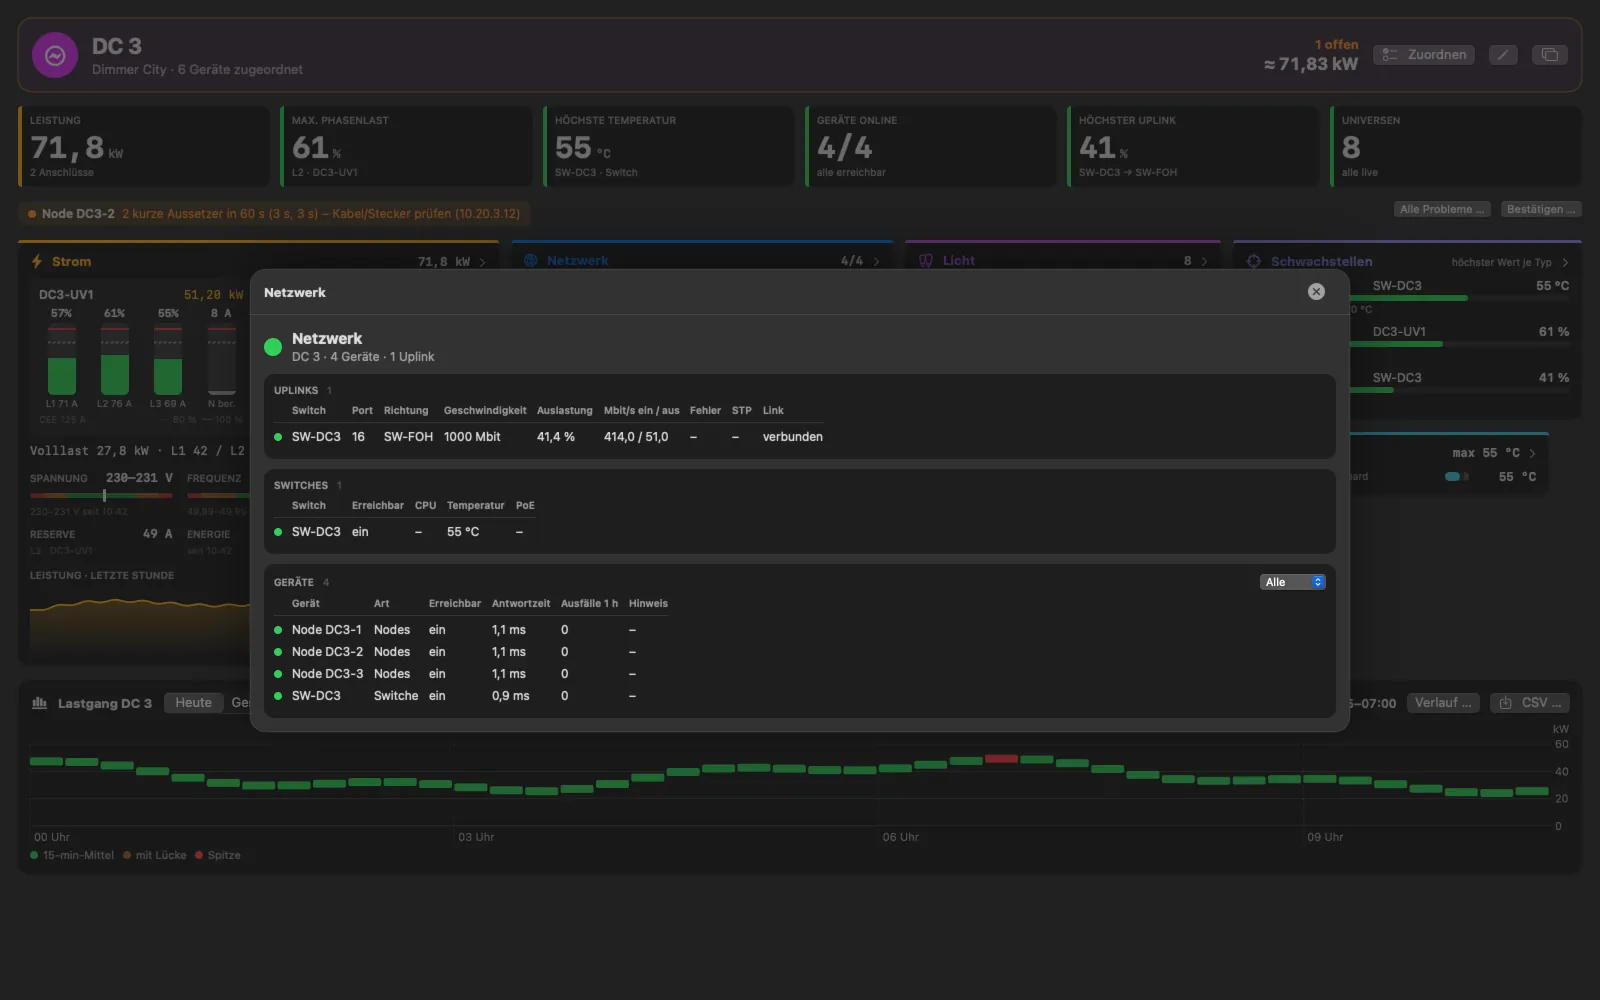
The example shows the network of DC 3: uplink to FOH with utilisation, the switch with CPU, temperature and PoE, and every device with response time and failures in the last hour – including the hint on the node with dropouts.

Mac app: site page DC 3 with the network pop-up – uplink to SW-FOH with utilisation, switch with temperature and four devices with response time
Network detail as a pop-up in the Mac app · demo data

Matrix

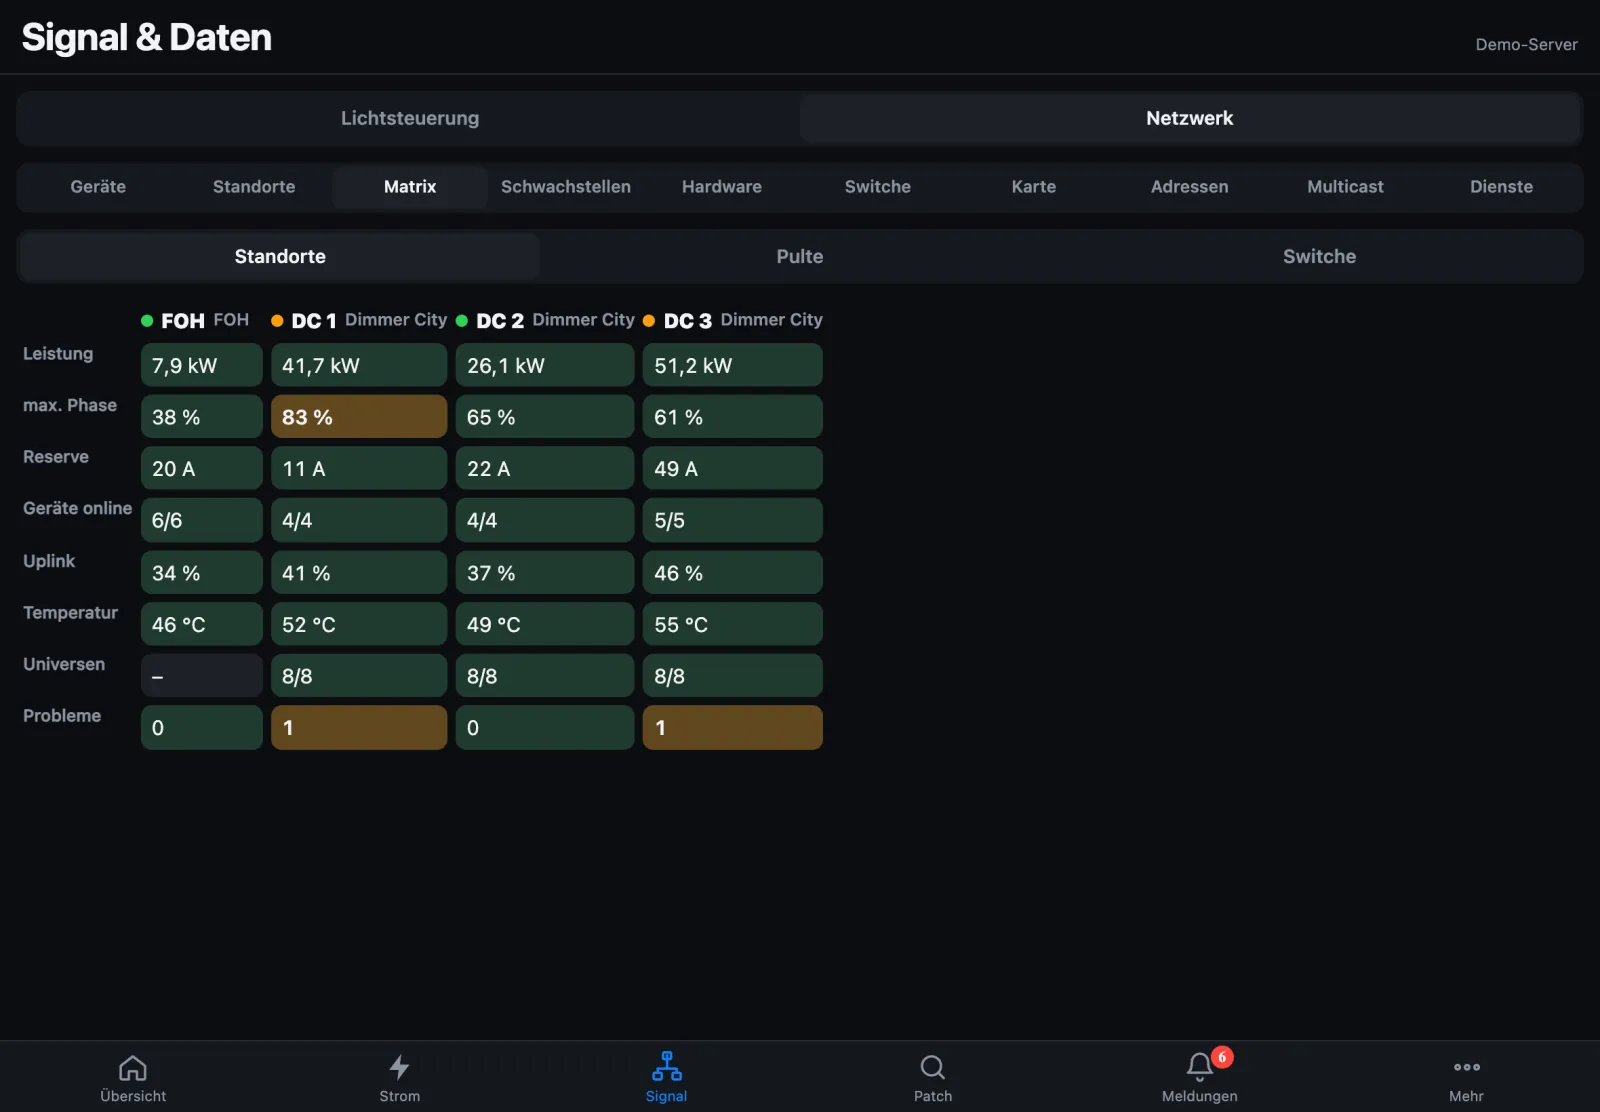
The matrix puts the sites side by side: power, highest phase, headroom, devices online, uplink, temperature, universes and problems – each cell with its own status colour. You see at once which dimmer city is out of line.

Switchable to consoles, processing units and switches. A table in landscape, a list on a phone in portrait; a tap opens the site or the device page.

Matrix in the manual (German)

Matrix with FOH and DC 1 to DC 3 as columns and key figures as rows, orange cells for DC 1 and DC 3
Site matrix · demo data

Weak spots

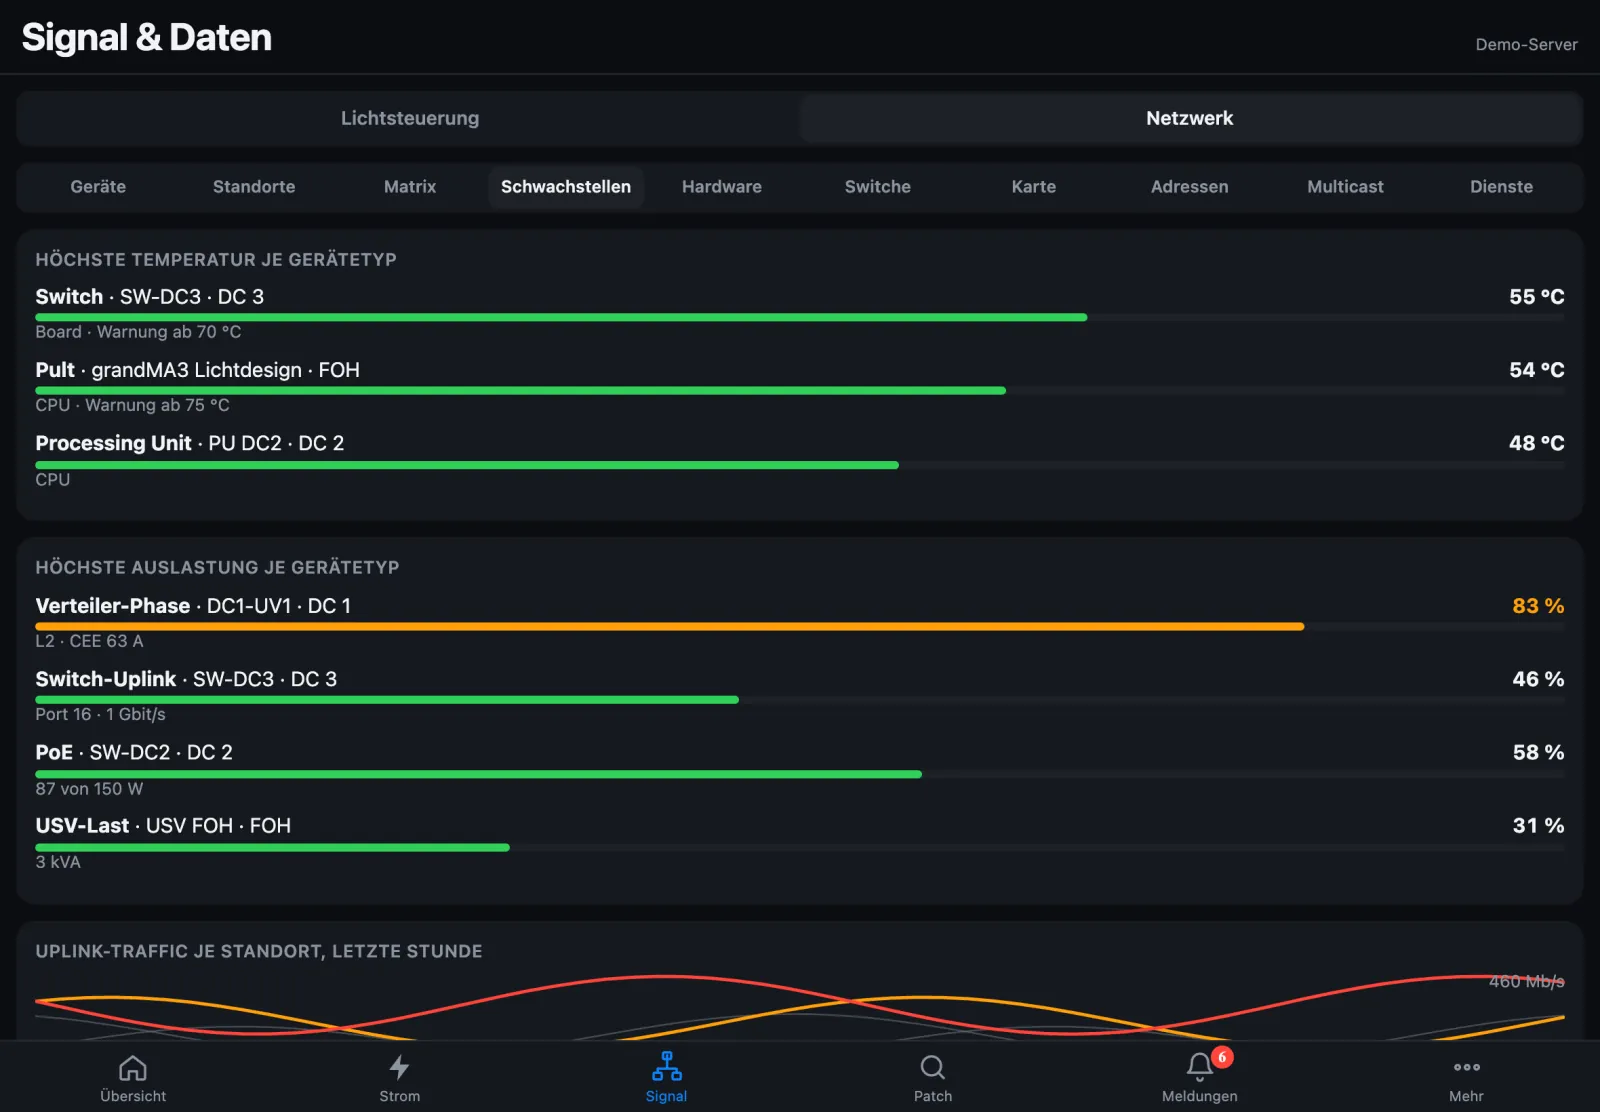
Where does it get tight first? Weak spots show the highest value per device type – temperature of switch, console and processing unit, load of distro phase, uplink, PoE and UPS – with the distance to the limit. Plus the uplink traffic per site over the last hour and the flaky devices: failures, link changes, restarts, packet loss or rising error counters.

For all devices, per site as tiles, or for a single site.

Weak spots in the manual (German)

Weak spots: highest temperature and highest load per device type as bars, the distro phase in DC 1 orange at 83 percent
Weak spots · demo data

Hall plan

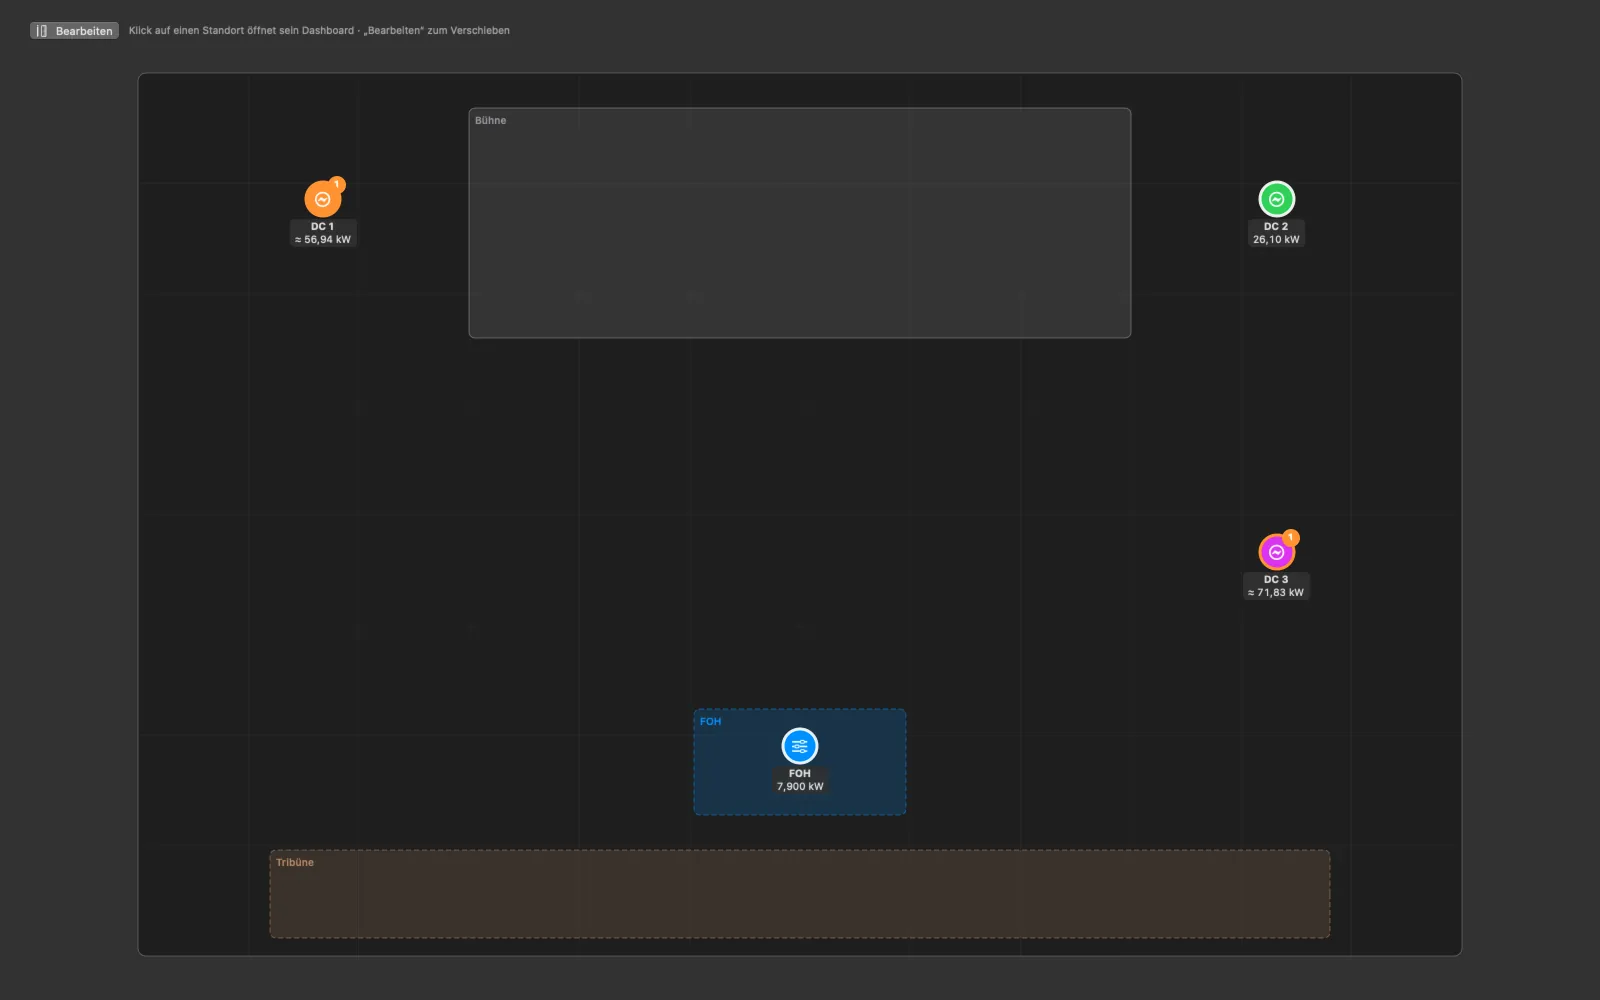
In the Mac app the sites sit on a floor plan of the venue: hall size in metres, areas for stage, FOH position, stands or backstage, and a floor plan as image or PDF in the background.

Each marker shows colour, power and problem count of its site; a click opens its page. You see at a glance where in the hall something is wrong.

Hall plan in the manual (German)

Hall plan in the Mac app: floor plan with stage, FOH position and stands, markers for FOH and DC 1 to DC 3 with status colour and power
Hall plan in the Mac app · demo data

Big screen and monitors

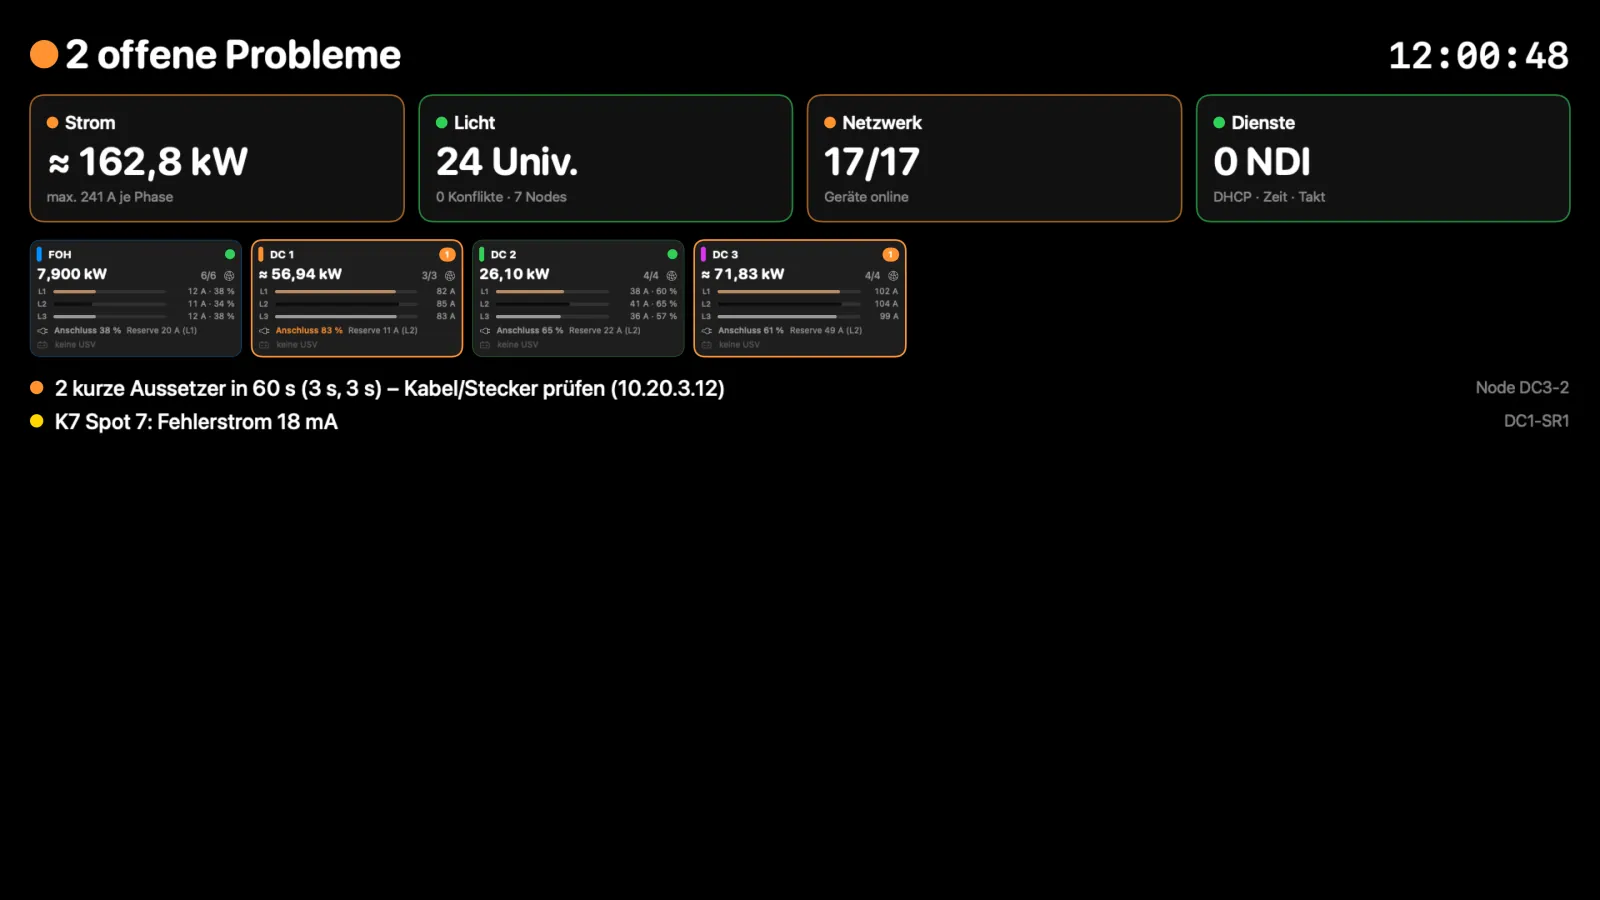
The big screen of the Mac app is a dark full-screen view with large type – overall with status, clock, the four areas, timecode, sites and problems, or for a single site. Several windows at once are possible, e.g. one monitor per dimmer city.

On the network it works without a Mac as well: /dc?auto=20 moves a screen to the next site every 20 seconds, /foh shows a full-screen view for FOH.

Big screen in the manual (German)

Big screen of the Mac app: one open problem, clock, power, lighting, network and services, the sites with phases and the problem list in large type
Big screen on the Mac · demo data

Status lights and limits in one place

The value at which something turns orange or red is set in one place. DC pages, overall page, matrix, site status, web app, alarms and blackbox all use the same numbers.

Quick search

⌘K finds devices, IP addresses, meters, universes, fixtures, switch ports by description or LLDP neighbour, MA stations and NDI sources – Enter jumps straight there.

Sites in a minute

“FOH + 6 dimmer cities” creates the usual sites with one click; you assign devices by drag and drop.