StageSense is currently in development and not yet available.
Overview & SitesPowerLighting & MAConsole DiagnosticsNetworkAlerts & NotificationsBlackbox & ReportsWeb App & PhoneServer, Client & Bridge

Features

Blackbox & Reports

What happened before the failure? Timeline of all areas, short report, job report with energy, custom dashboards.

Screenshots show the app in German with demo data; English screenshots follow with version 1.4.

Blackbox – what happened before the failure?

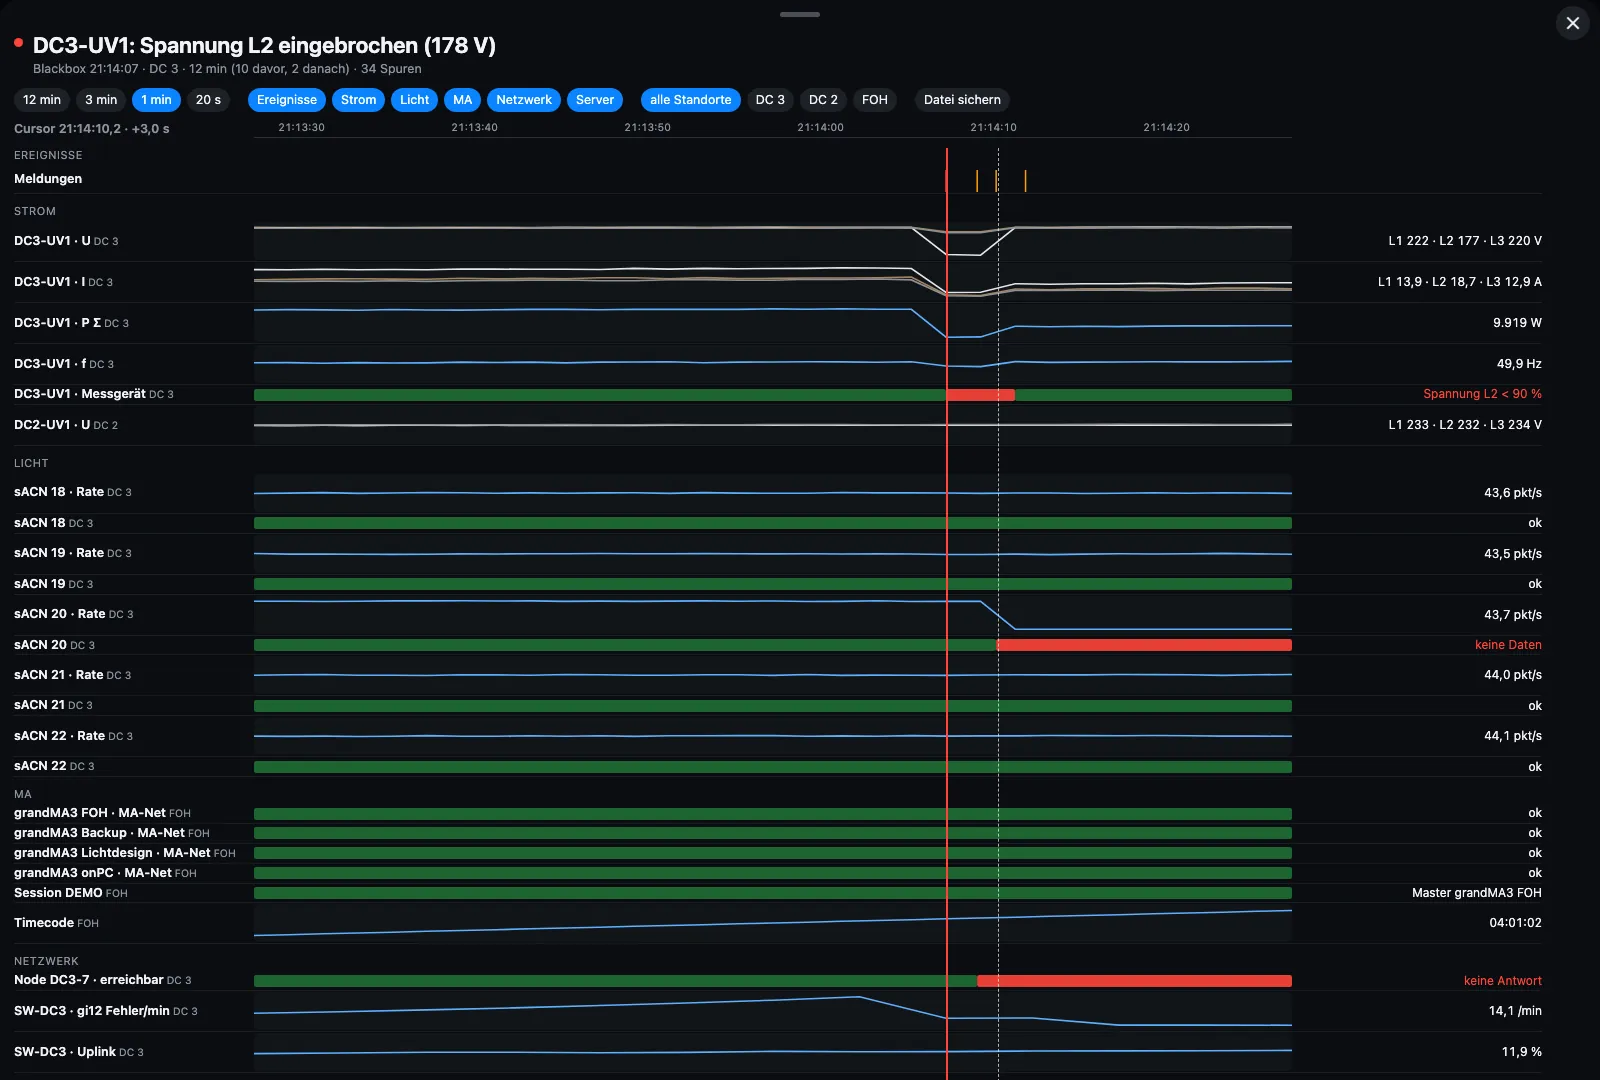
After a failure it is often unclear what came first: the power, the switch or the console. The blackbox therefore keeps the last minutes of power, lighting, MA, network and server in memory. On a fault – alarm, device unreachable, universe gone, voltage dip, phase lost – it saves 10 minutes before and 2 minutes after by default.

The timeline stacks all tracks with a shared cursor, the sequence of events below. “Save now” also captures faults that trigger no alarm – such as a short flicker only the audience sees. The short report sums up trigger, affected device and sequence as a PDF.
Blackbox in the manual (German)

Blackbox timeline after a voltage dip: voltage, current and power of the distro, sACN universes, MA consoles and network stacked, red line at the trigger
Timeline after a voltage dip · demo data

Jobs & reports

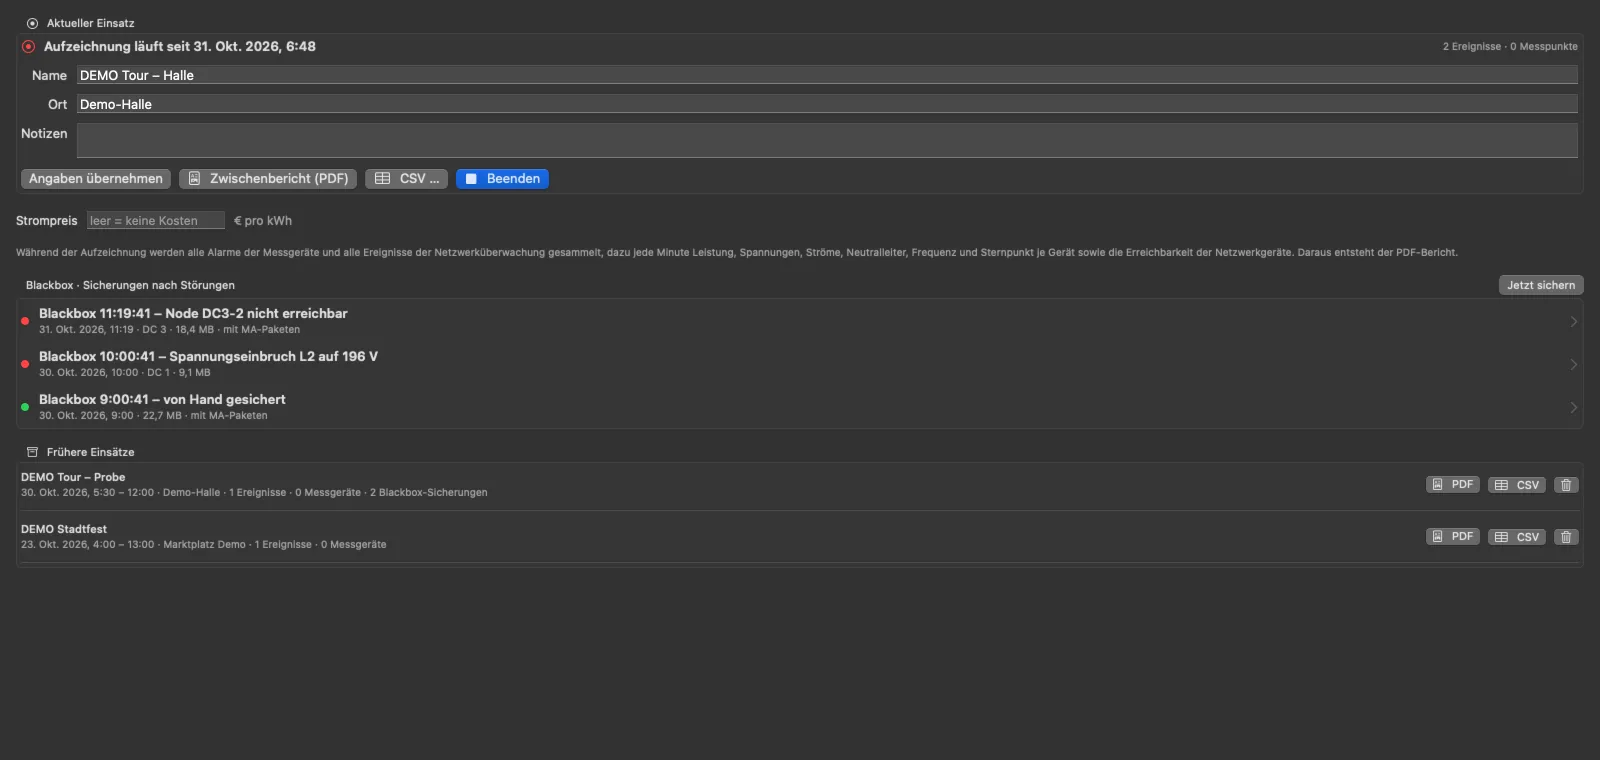
A recording collects all alarms and events during a job, and every minute the power, voltages, currents, neutral, frequency and star point per meter plus the reachability of the network devices. An interim report at any time, at the end a PDF with histories, events and availability per device.

The report also covers energy and cost – kWh per distro, site and job, with a price per kWh the cost – and power quality based on EN 50160, explicitly not a compliance certificate.

Jobs & reports in the manual (German)

Jobs and reports in the Mac app: running recording, three blackbox captures and two previous jobs
Jobs & reports in the Mac app · demo data

Custom dashboards

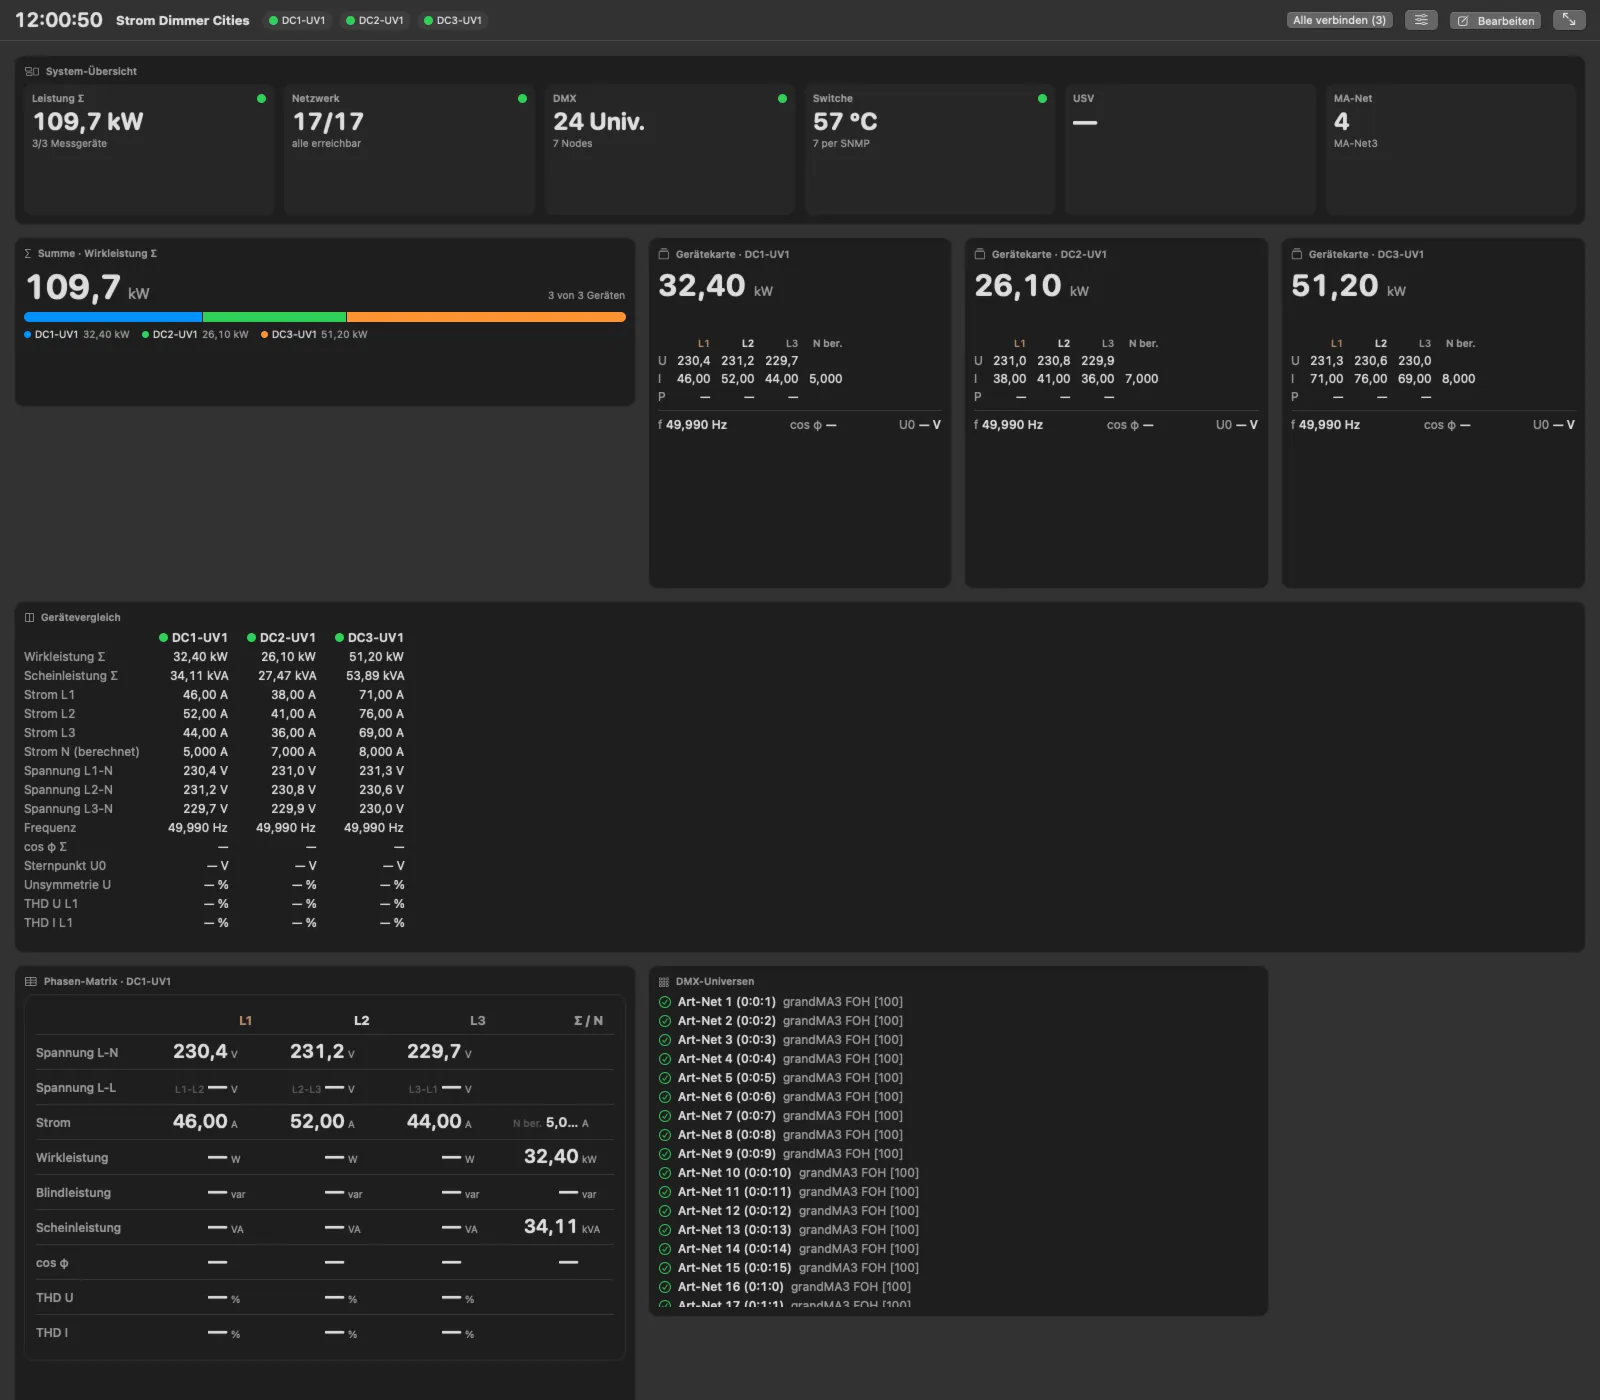
In the Mac app you build your own dashboards from blocks: device card, single value, key figure bar, phase matrix, phasor and star point, history, device comparison, network devices, switch, UPS, DMX universes, MA-Net, timecode and site tile.

Blocks can be limited to one site – e.g. one dashboard per dimmer city with only its devices, universes and UPS.

Dashboards in the manual (German)

Custom dashboard in the Mac app with blocks for power, network and lighting
Custom dashboard · demo data

Everywhere

Blackbox captures on the Mac, on the server and in the web app after signing in with a PIN – each with time, trigger, site and size.

CSV for Excel

Minute averages of all meters per job or period – ready for Excel.

Show profiles

A show profile stores a complete production and loads it again with one click – for recurring jobs or the next tour stop.