StageSense is currently in development and not yet available.
Overview & SitesPowerLighting & MAConsole DiagnosticsNetworkAlerts & NotificationsBlackbox & ReportsWeb App & PhoneServer, Client & Bridge

Features

Power

Meters and StageSmarts distros, headroom to the breaker, full load from the patch, load profile and power plan.

Screenshots show the app in German with demo data; English screenshots follow with version 1.4.

Meters and distros

StageSense reads Janitza meters via Modbus TCP or RS485, StageSmarts distros with every channel, and network UPSs via SNMP. Everything appears in one unit – kW or A, the same everywhere.

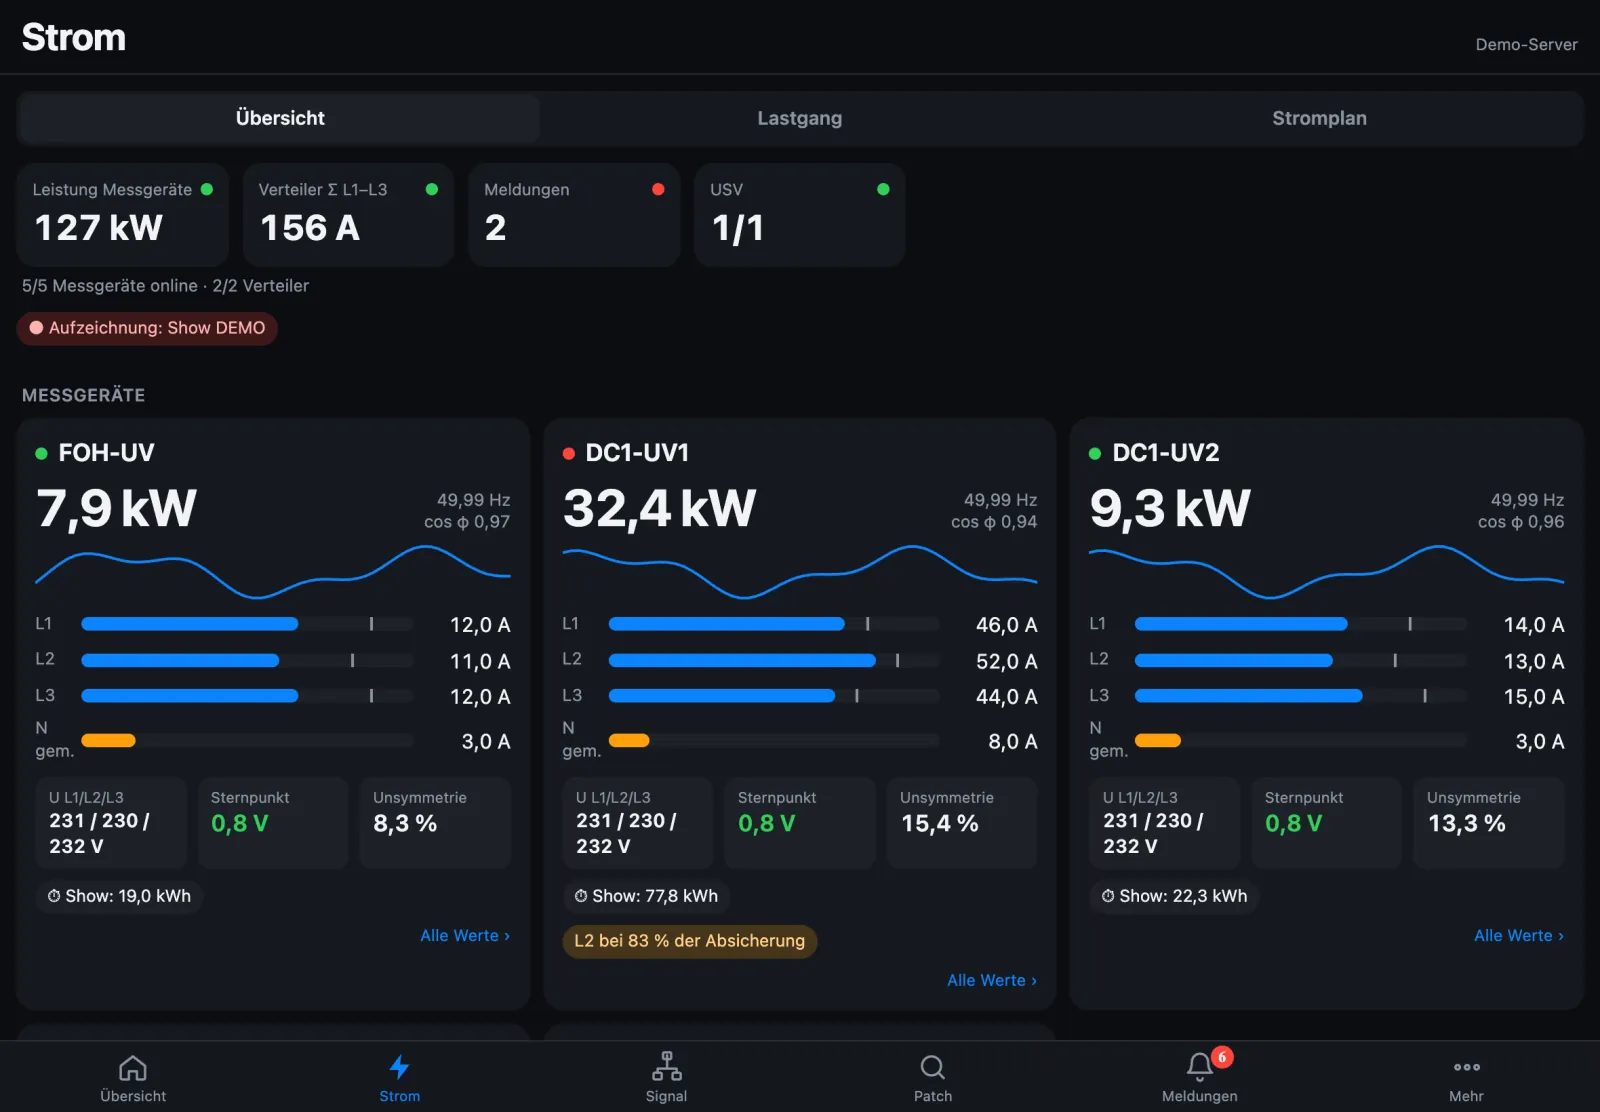
Per feed: power, current and voltage per phase, neutral measured or calculated, frequency, cos φ, star point, unbalance and residual current, plus sub-counters such as “Show: 77.8 kWh”. A running recording for the job report shows at the top.
Meters in the manual (German)

Power overview: power of the meters, distros, alerts, UPS, below FOH-UV, DC1-UV1 and DC1-UV2 with phase bars, voltage, star point and unbalance
Power overview · demo data

Every value and every channel

Tap a meter to see every value with history: active power, current per phase, voltages, power quality with THD, energy – each with minimum and maximum since start, and the latest alarms.

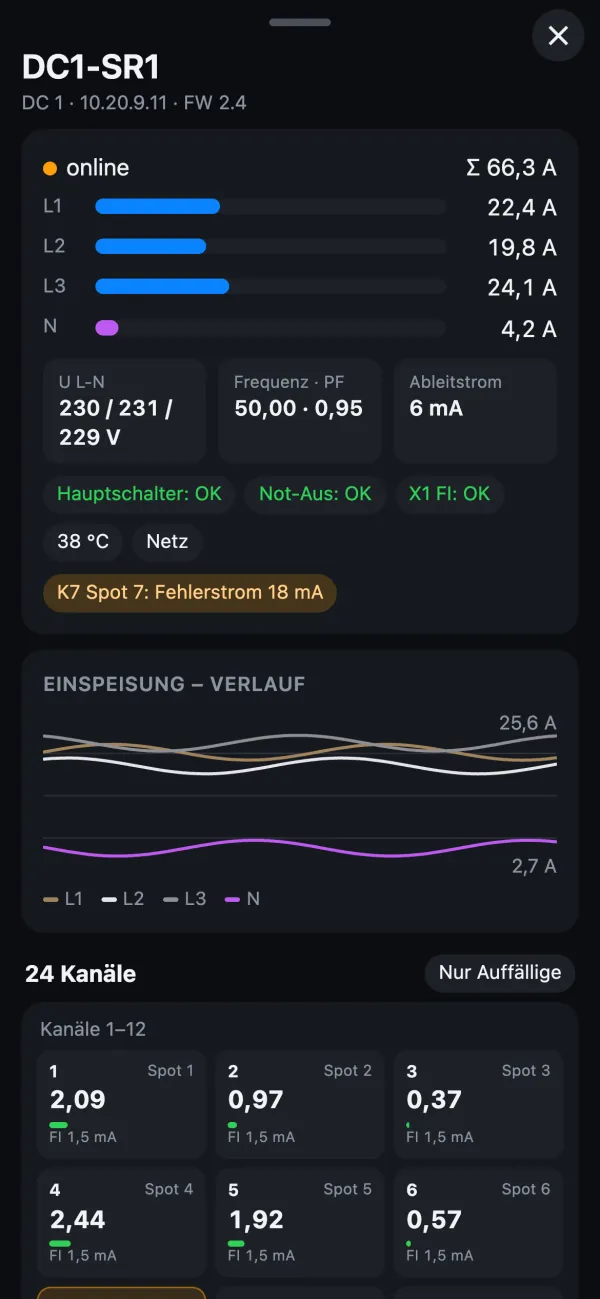
A StageSmarts distro shows the feed with history, main breaker, emergency stop and RCD, temperature and mains or battery operation – and every channel with current and residual current. “Only unusual” hides the rest.

StageSmarts in the manual (German)

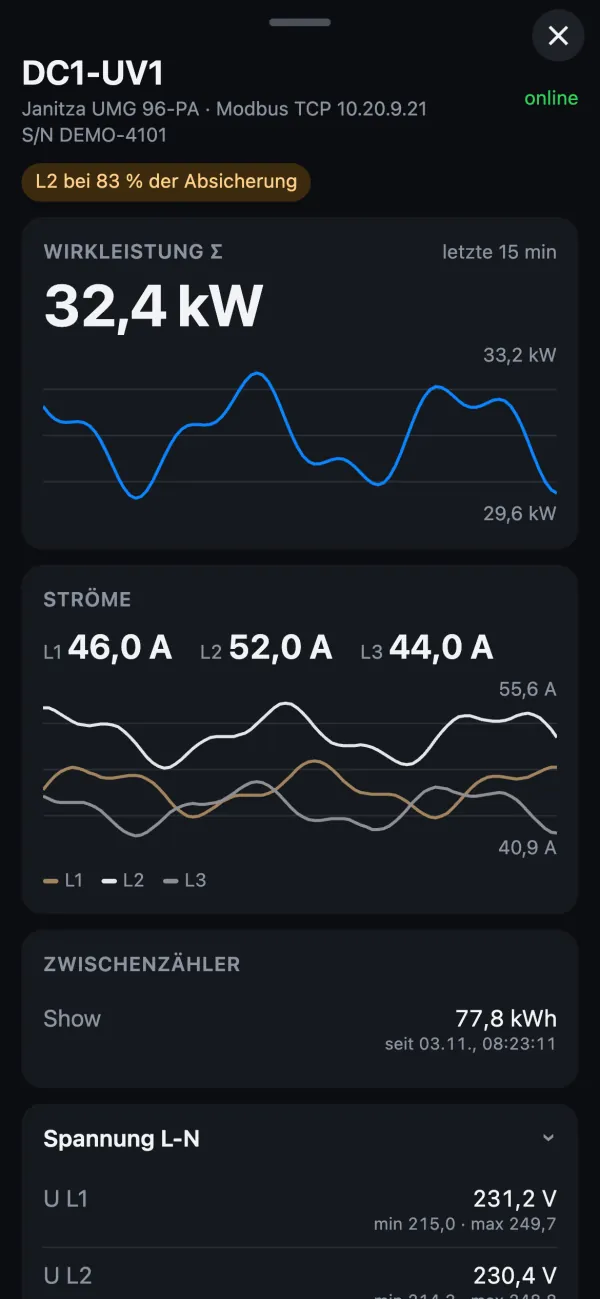
Meter DC1-UV1 on the phone: active power 32.4 kW with history and currents per phaseStageSmarts distro DC1-SR1 on the phone: feed, breakers, history and the first channels
Meter and StageSmarts distro on the phone · demo data

Power detail per site New in 1.3.5

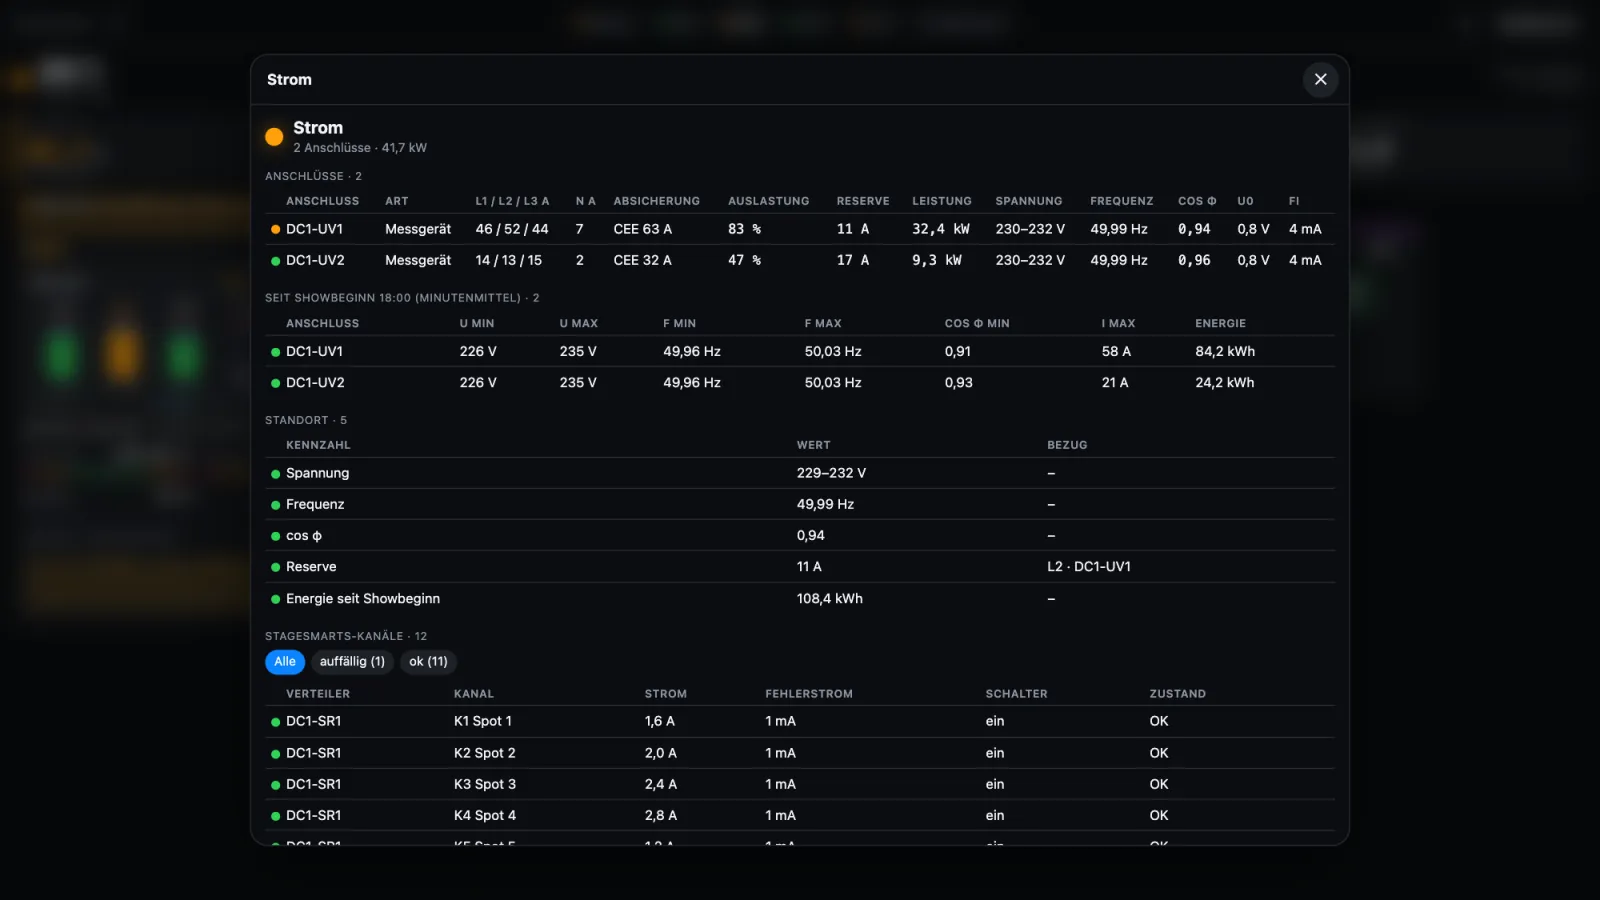
The power detail of a DC page shows per feed the phases, neutral, breaker, load, headroom, power, voltage, frequency, cos φ, star point U0 and RCD. Below that minimum and maximum since show start with the energy per feed, the key figures of the site and the StageSmarts channels.

Headroom means how many amps are left on the highest phase before the breaker – the number you want to know before switching something on.

Feeds and load in the manual (German)

DC page DC 1 with the power detail open: table of feeds, minute averages since show start, key figures and StageSmarts channels
Power detail in DC 1 · demo data

Full load from the patch New in 1.3.5

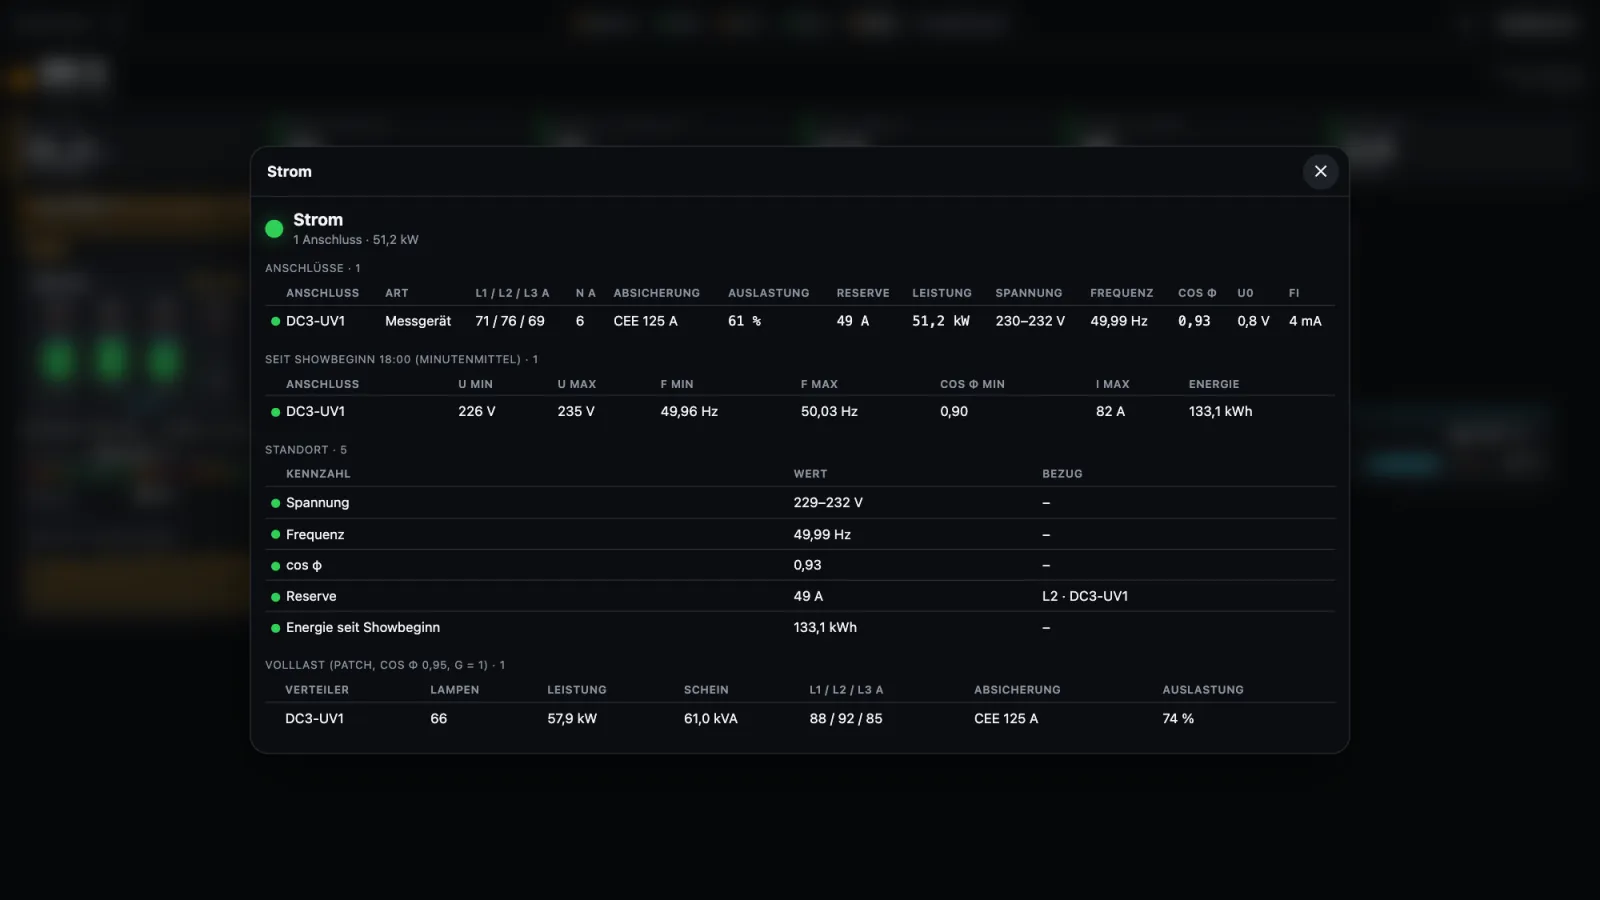
What happens when every fixture goes to full? From the patch StageSense takes each fixture at its maximum power and puts it per phase against the breaker of its distro (cos φ 0.95, diversity factor 1).

The result shows as a blue mark in the phase bar, as a line on the DC tile, in the matrix, as the “Full load (patch)” figure on the overall page and as its own section in the power detail. A planning value from the patch – no status colour, no alarm, only hints when a phase would exceed its breaker.

Power plan and patch in the manual (German)

DC page DC 3 with the full-load line in power and the full-load section in the power detail: fixtures, power, currents per phase and load against the breaker
Full load in DC 3 · demo data

Power detail on the Mac

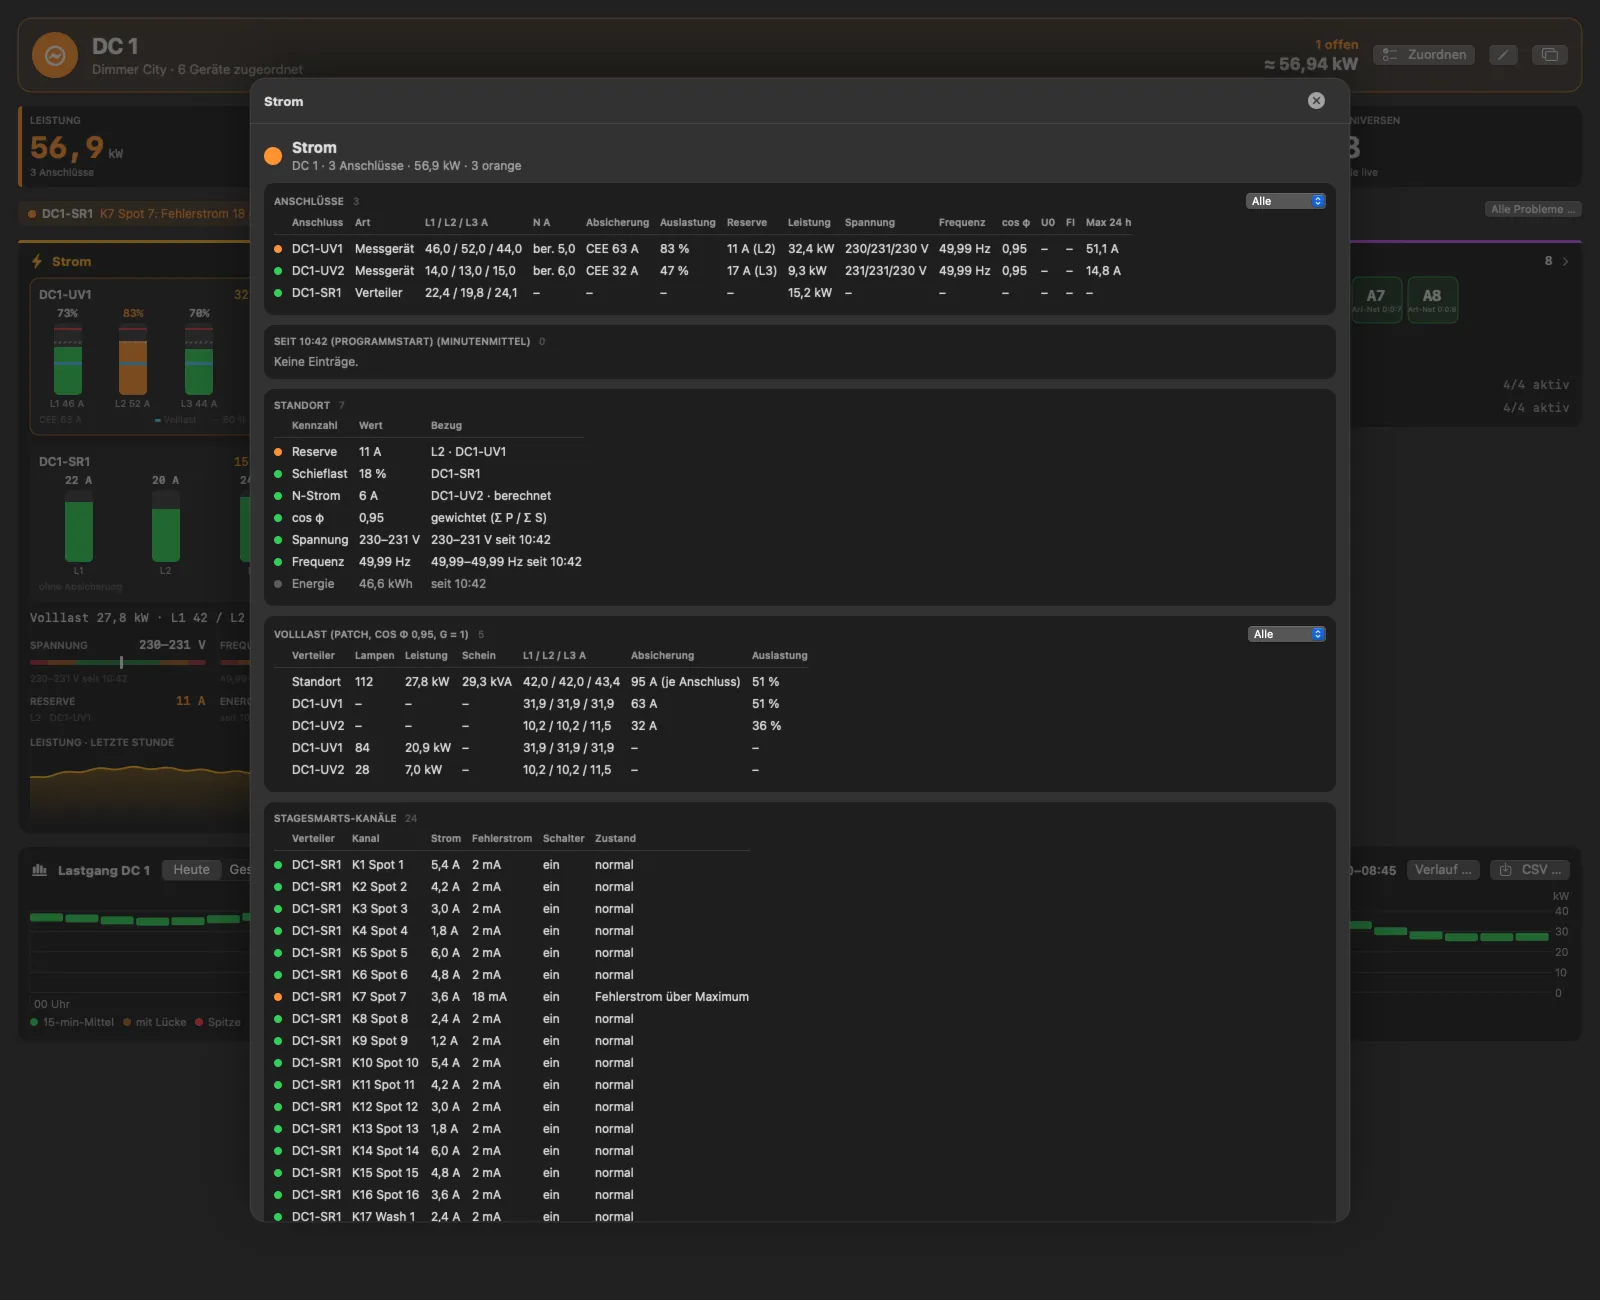
The Mac app shows the same detail in full in a pop-up – down to the full-load section with fixtures, power, apparent power, currents per phase and load.

Mac app: site page DC 1 with the power pop-up – feeds, site key figures, full load from the patch and StageSmarts channels with one residual current
Power detail as a pop-up in the Mac app · demo data

Load profile and peak demand

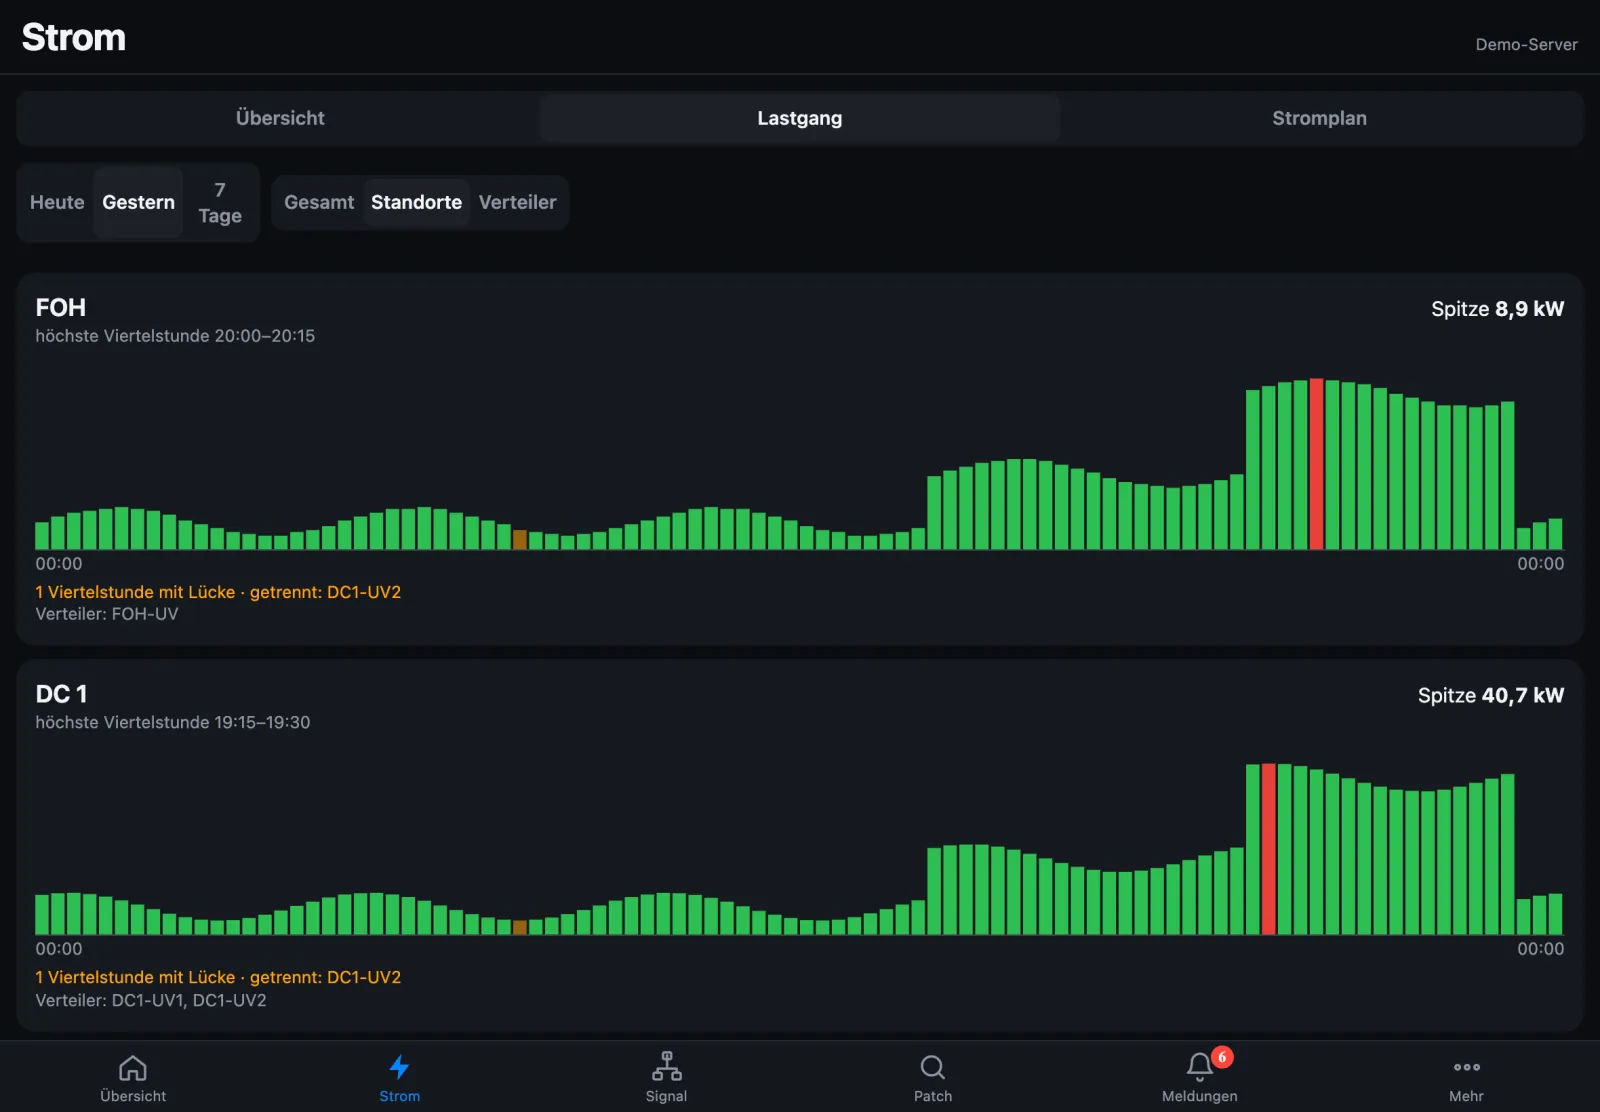
From live values StageSense builds 15-minute averages of active power – like the utility’s load profile meter, but only from what StageSense measured itself. Overall, per site or per distro, for today, yesterday or 7 days, with the peak in red.

Gaps stay honestly visible: if a device is missing, the quarter hour is marked instead of filled with 0. The minute averages are available as CSV for Excel, per period or per job; the server keeps them in its energy archive – for histories over a day, a week or a tour.

Load profile in the manual (German)

Yesterday’s load profile per site: green 15-minute bars for FOH and DC 1, the peak in red, one quarter hour with a gap
Load profile per site · demo data

Power plan

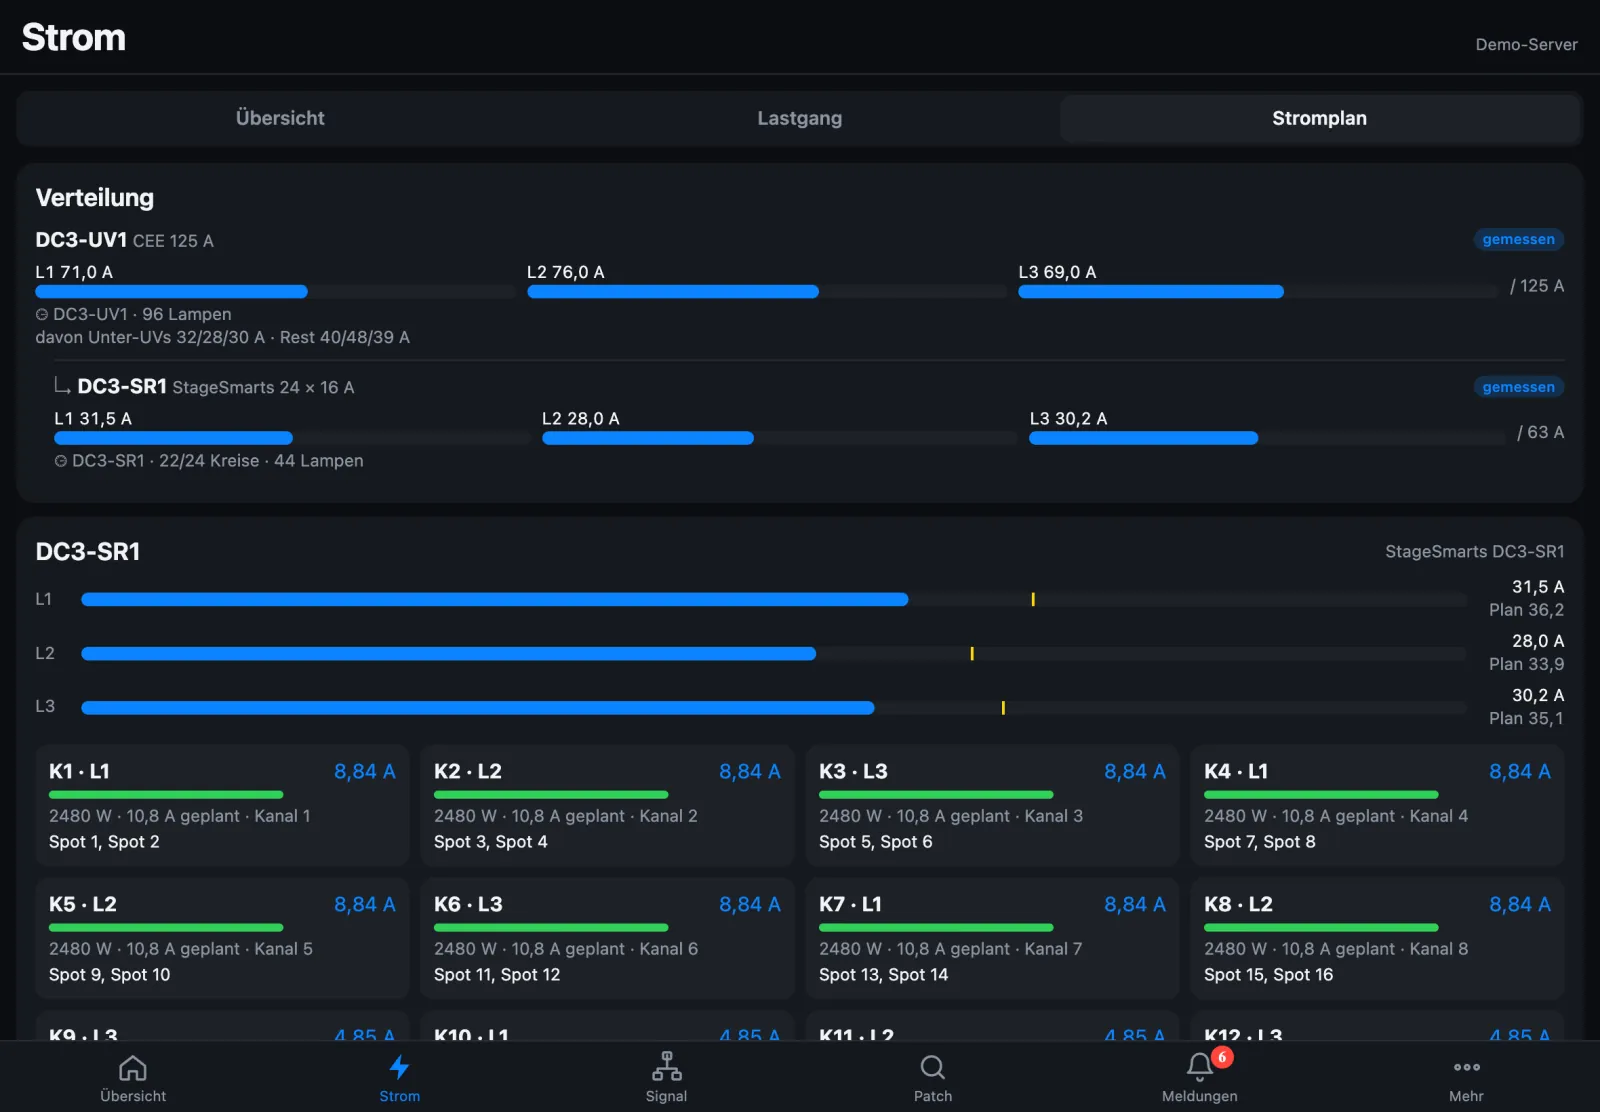
Calculated from the patch: power per fixture, distro, plug box, socket, circuit and phase. Per distro planned and measured currents side by side, per circuit the fixtures and the load. The distribution view shows main and sub distros with measured or calculated load.

The power per fixture type comes from the built-in power library with more than 900 fixture types, or is remembered per type.

Power plan in the manual (German)

Power plan: distribution DC3-UV1 with sub distro DC3-SR1, below plan and measurement per phase and the circuits with their fixtures
Power plan · demo data

Power alarms out of the box

Under- and overvoltage, phase loss, frequency and load per feed are reported without any alarm rule of your own – by the limits, with a resolved message. Your own alarm rules per meter come on top.

UPS

Network UPSs via SNMP and USB UPSs: mains or battery, charge, runtime, load, battery condition and self-test – with an alert as soon as the UPS runs on battery.

MRG/connex via USB

Distros with the USB socket “NW” are read via the StageSense Bridge – by the Mac app and by the server – or directly on the server, always read-only. Bridge

Energy and power quality in the report

The job report lists kWh per distro, site and job, with an electricity price also the cost, plus power quality based on EN 50160 – explicitly not a compliance certificate. Report